Until now, for each new trace step, users had to close the trace.xplorer, select the next trace step in the report, and then reopen the trace.xplorer. The previously displayed trace section (scroll position and zoom level) was lost in the process and had to be restored manually. This workflow required many clicks and created a lot of visual clutter on the screen.
To improve the situation, the report views in ecu.test and the Report Viewer now work more closely with the trace.xplorer.
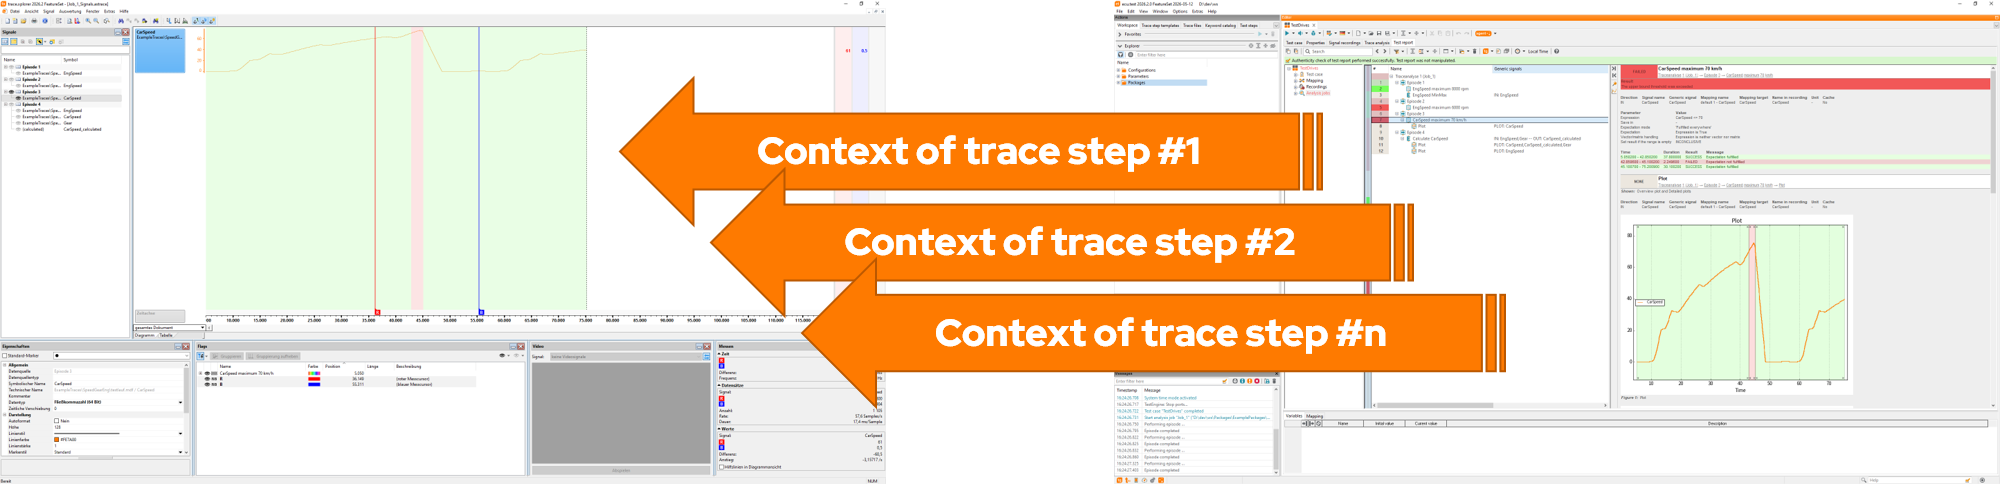
When launched from within a report, it continues to display the signals involved in the current trace step, as well as any evaluations generated. However, if you select a different trace step, the open trace.xplorer instance and the displayed trace section are now retained.
To improve the situation, the report views in ecu.test and the Report Viewer now work more closely with the trace.xplorer.
When launched from within a report, it continues to display the signals involved in the current trace step, as well as any evaluations generated. However, if you select a different trace step, the open trace.xplorer instance and the displayed trace section are now retained.
Only the visualized trace step context - that is, the displayed signals and evaluations - is updated. This makes it possible to analyze the report information much more efficiently than before, especially when using multiple monitors.
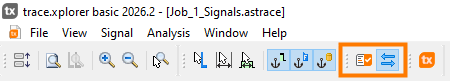
The new Test report toolbar allows you to access the caller's report view (ecu.test or Report Viewer) with a single click. You can also enable or disable the automatic updating of context information as needed.
The new Test report toolbar allows you to access the caller's report view (ecu.test or Report Viewer) with a single click. You can also enable or disable the automatic updating of context information as needed.