With consistent workflows and highly functional interfaces for the flexible connection of further tools, we see the Automotive DevOps Platform as a collaborative platform for all stakeholders in the DevOps process of vehicle development.
In a targeted manner, we strive for close collaboration in the development of test cases (Dev) and their execution (Ops) based on direct feedback and seamless traceability. Special platform features that focus on overarching workflows are important in this context.
Automotive DevOps Platform
Our tools fit into every phase of automated vehicle software testing. When they are linked together, they achieve maximum impact – as an Automotive DevOps Platform.
DevOps at tracetronic
With the Automotive DevOps Platform, we go from the big picture to the details and unite all phases of vehicle software testing – from planning the test scopes to summarizing the test results. At the same time, continuous monitoring across all test phases always provides an overview of all activities – even with several thousand test executions per day and in different test environments.
Test planning
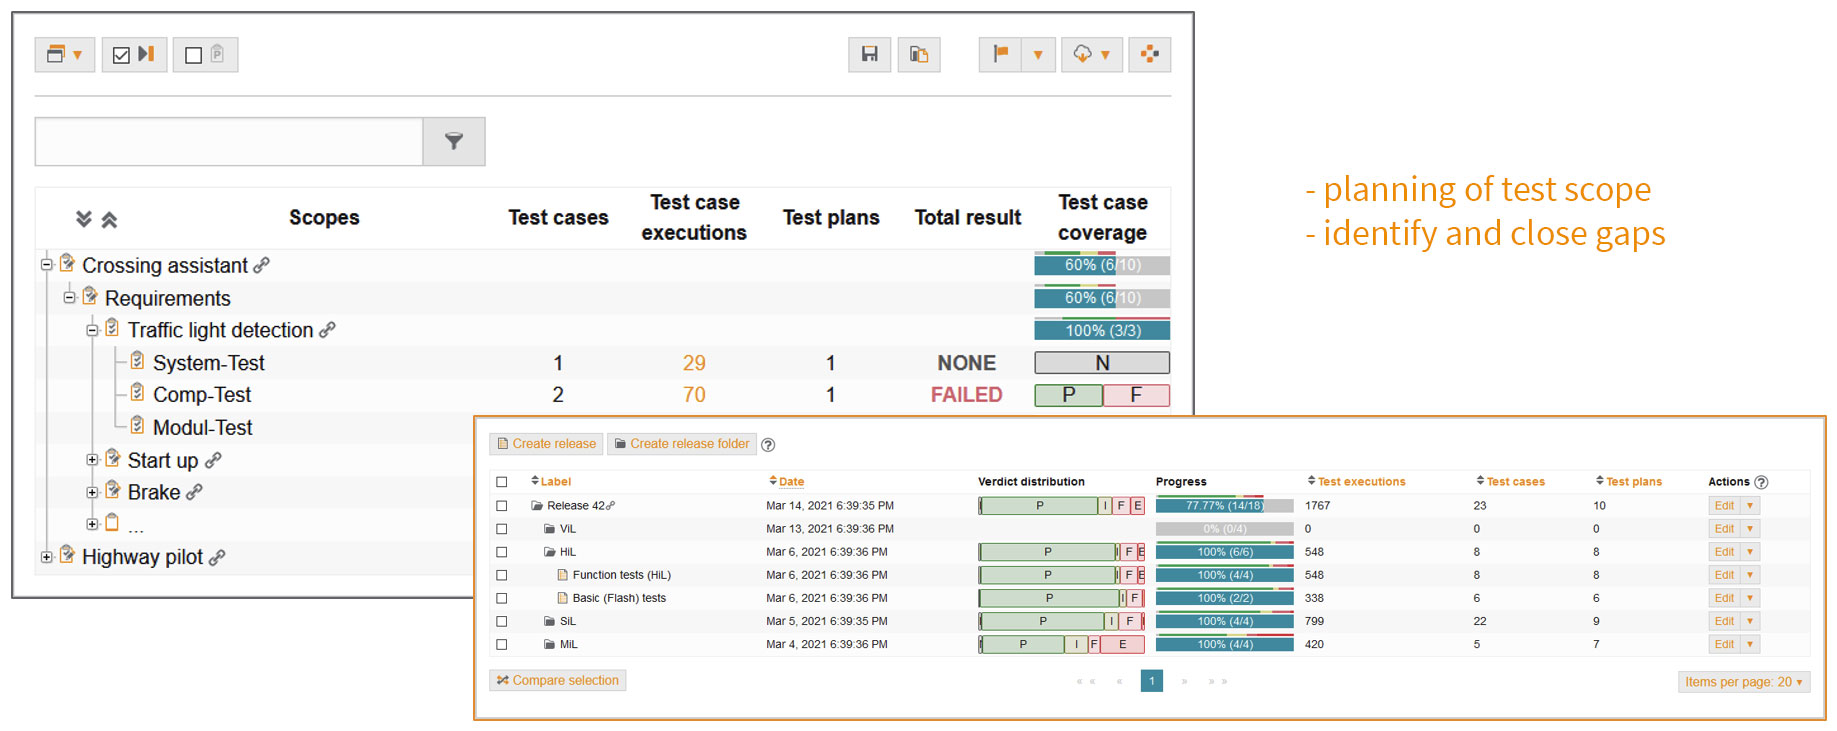
In the planning phase, the test scopes within a test level are defined.
The basis is formed by requirements that can be read in from a wide variety of sources – via direct connection of ALM tools (e.g., Octane, IBM RQM, Polarion), a proprietary API or by importing various exchange formats (e.g., ReqIF).
If the test suite is designed for a new requirement, the relevant tests and the associated set of all possible parameter values (parameter spaces) will be defined. What is to be tested with which test cases in physical (HiL) or virtual environments (MiL, SiL) is then planned. Here, the entire team has an up-to-date overview of the test scope and the status of the test process at all times.
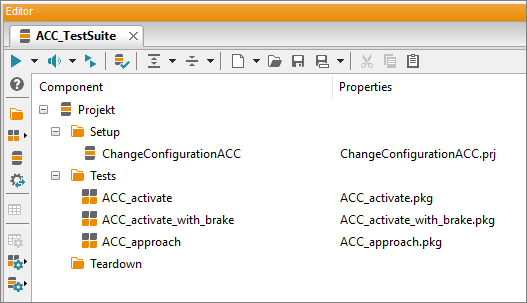
Test case development
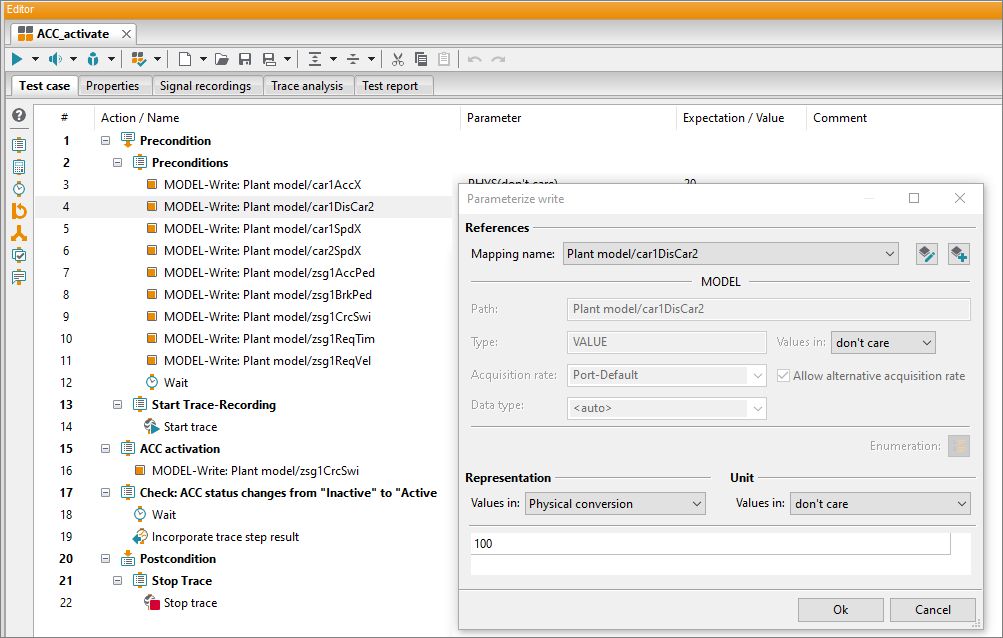
In this step, the focus is on the development and management of requirements- and experience-based as well as reusable test cases for automated execution in both physical (HiL) and virtual test environments (SiL, MiL).
With each new requirement from vehicle manufacturers, software functions are developed for ECUs. These must be verified and validated using test suites. The scope of these test suites is variable and depends on the complexity of the vehicle function. At the very least, the defined specifications of the statutory standard norms for the newly developed vehicle functions must be tested. This can be done in the form of many real and virtual driving kilometers, but also on the basis of various scenarios in which the new driving functions are tested critically and evaluated in detail.
With each new requirement from vehicle manufacturers, software functions are developed for ECUs. These must be verified and validated using test suites. The scope of these test suites is variable and depends on the complexity of the vehicle function. At the very least, the defined specifications of the statutory standard norms for the newly developed vehicle functions must be tested. This can be done in the form of many real and virtual driving kilometers, but also on the basis of various scenarios in which the new driving functions are tested critically and evaluated in detail.
Trace analysis development
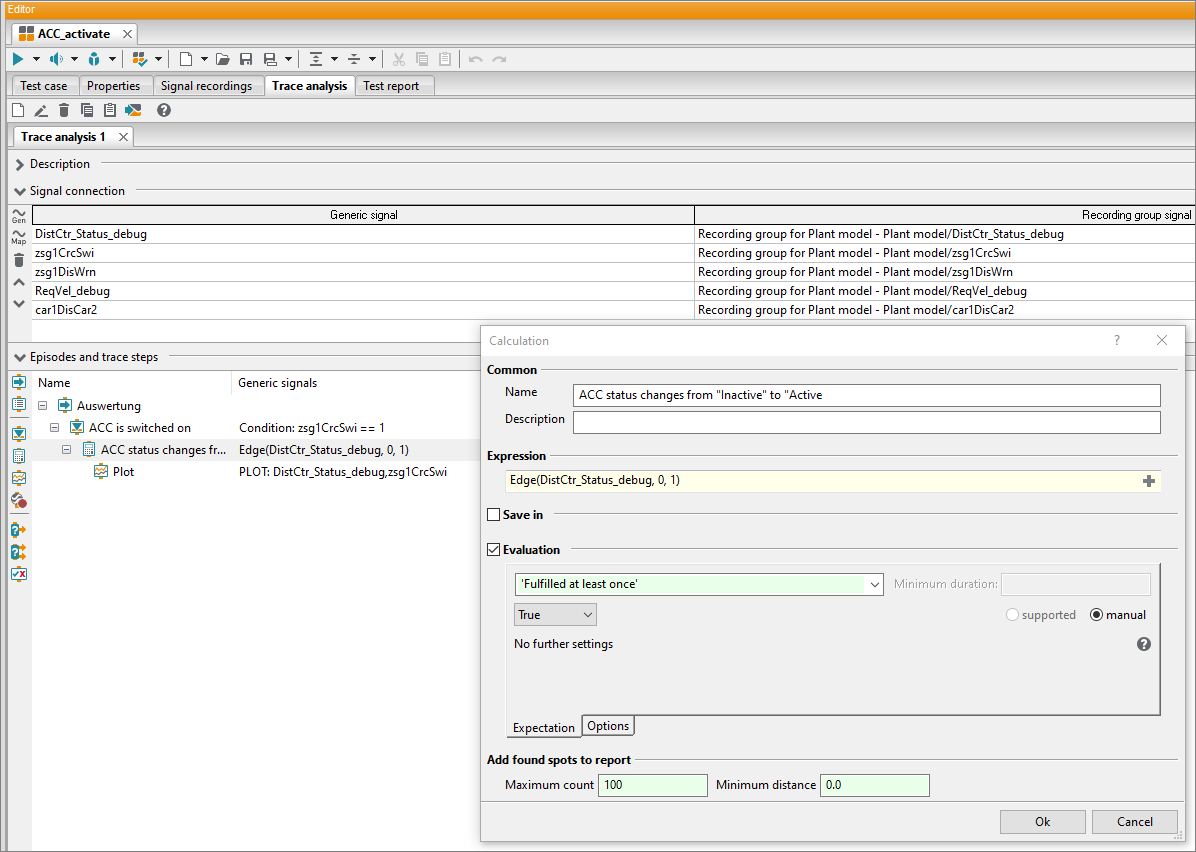
During the execution of a test case, measurement data or traces are recorded. Numerous recording formats (e.g., Matlab, ASC, MDF, MP4, WAV) are supported. The purpose of trace analysis is to examine these in detail and with regard to different criteria. It starts with the requirements that are placed on a signal course and ends with the fully automated generation of a test report. The goal is to analyze multiple traces from different recording sources along a common, synchronized time line.
Trace analysis development is similar to test case development, both in terms of logic and in terms of sequence. The recorded signals of different tools are analyzed measuring point by measuring point, independently of the measuring grid. Meaningful diagrams help to provide a quick overview of the places where the signal characteristics deviate from the given requirements.
Trace analysis development is similar to test case development, both in terms of logic and in terms of sequence. The recorded signals of different tools are analyzed measuring point by measuring point, independently of the measuring grid. Meaningful diagrams help to provide a quick overview of the places where the signal characteristics deviate from the given requirements.
Test execution
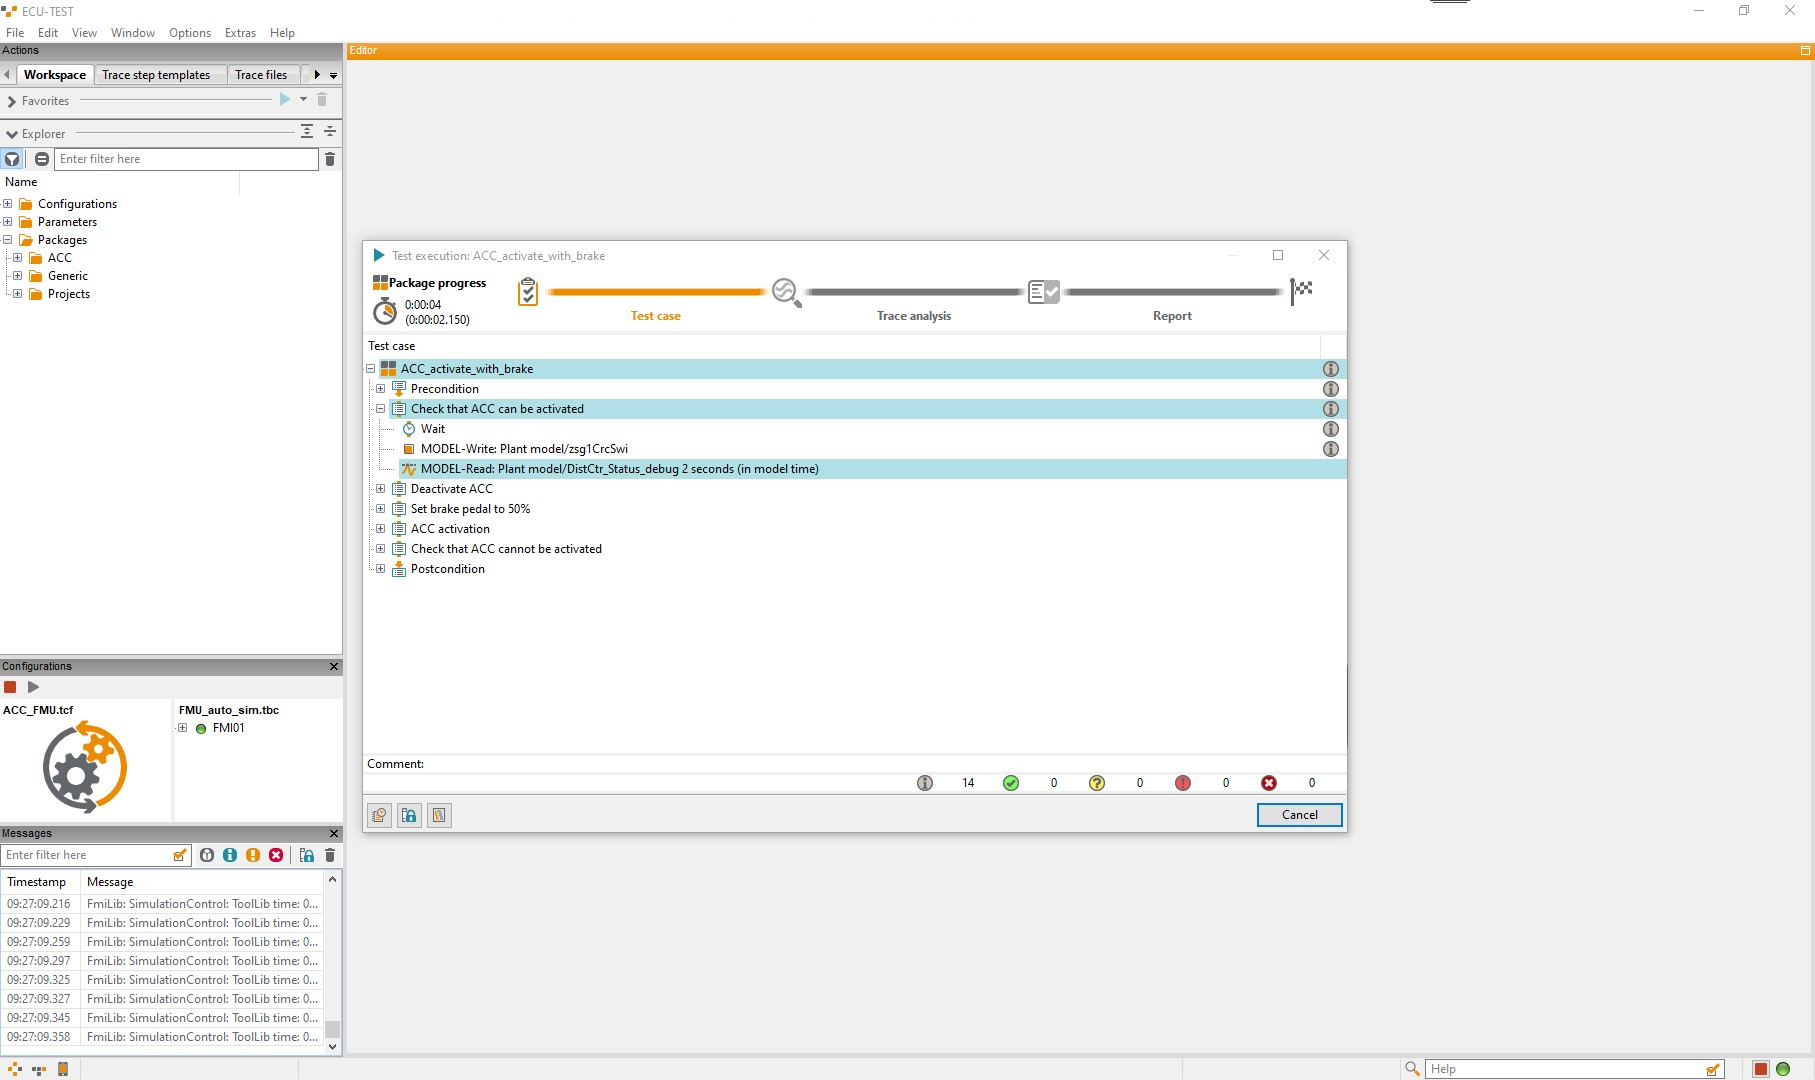
Intelligent and integrated test execution ensures that tests are automatically distributed to available test benches.
At any time, the best possible utilization can be ensured and the current status of the test resources can be monitored.
At any time, the best possible utilization can be ensured and the current status of the test resources can be monitored.
Trace analysis
Testing and analysis belong together, like starting and braking. However, both do not necessarily have to be performed immediately one after the other. This means that the traces can also be analyzed downstream, and on any PC. Coveted test benches will thus be available sooner for testing again, and the test throughput is also increased significantly.
Recordings made during the test run and the defined trace analyses are transferred automatically to test.guide as an analysis job. The tool then organizes the available resources for trace analysis on its own again using the ResourceAdapter.
Does the test object meet the test specification? Is the measuring device functioning correctly? Has the correct measuring range been selected? All details of the trace analysis and the stimulation are presented clearly in a test report for each individual step of the analysis and then stored automatically in test.guide.
Test result review
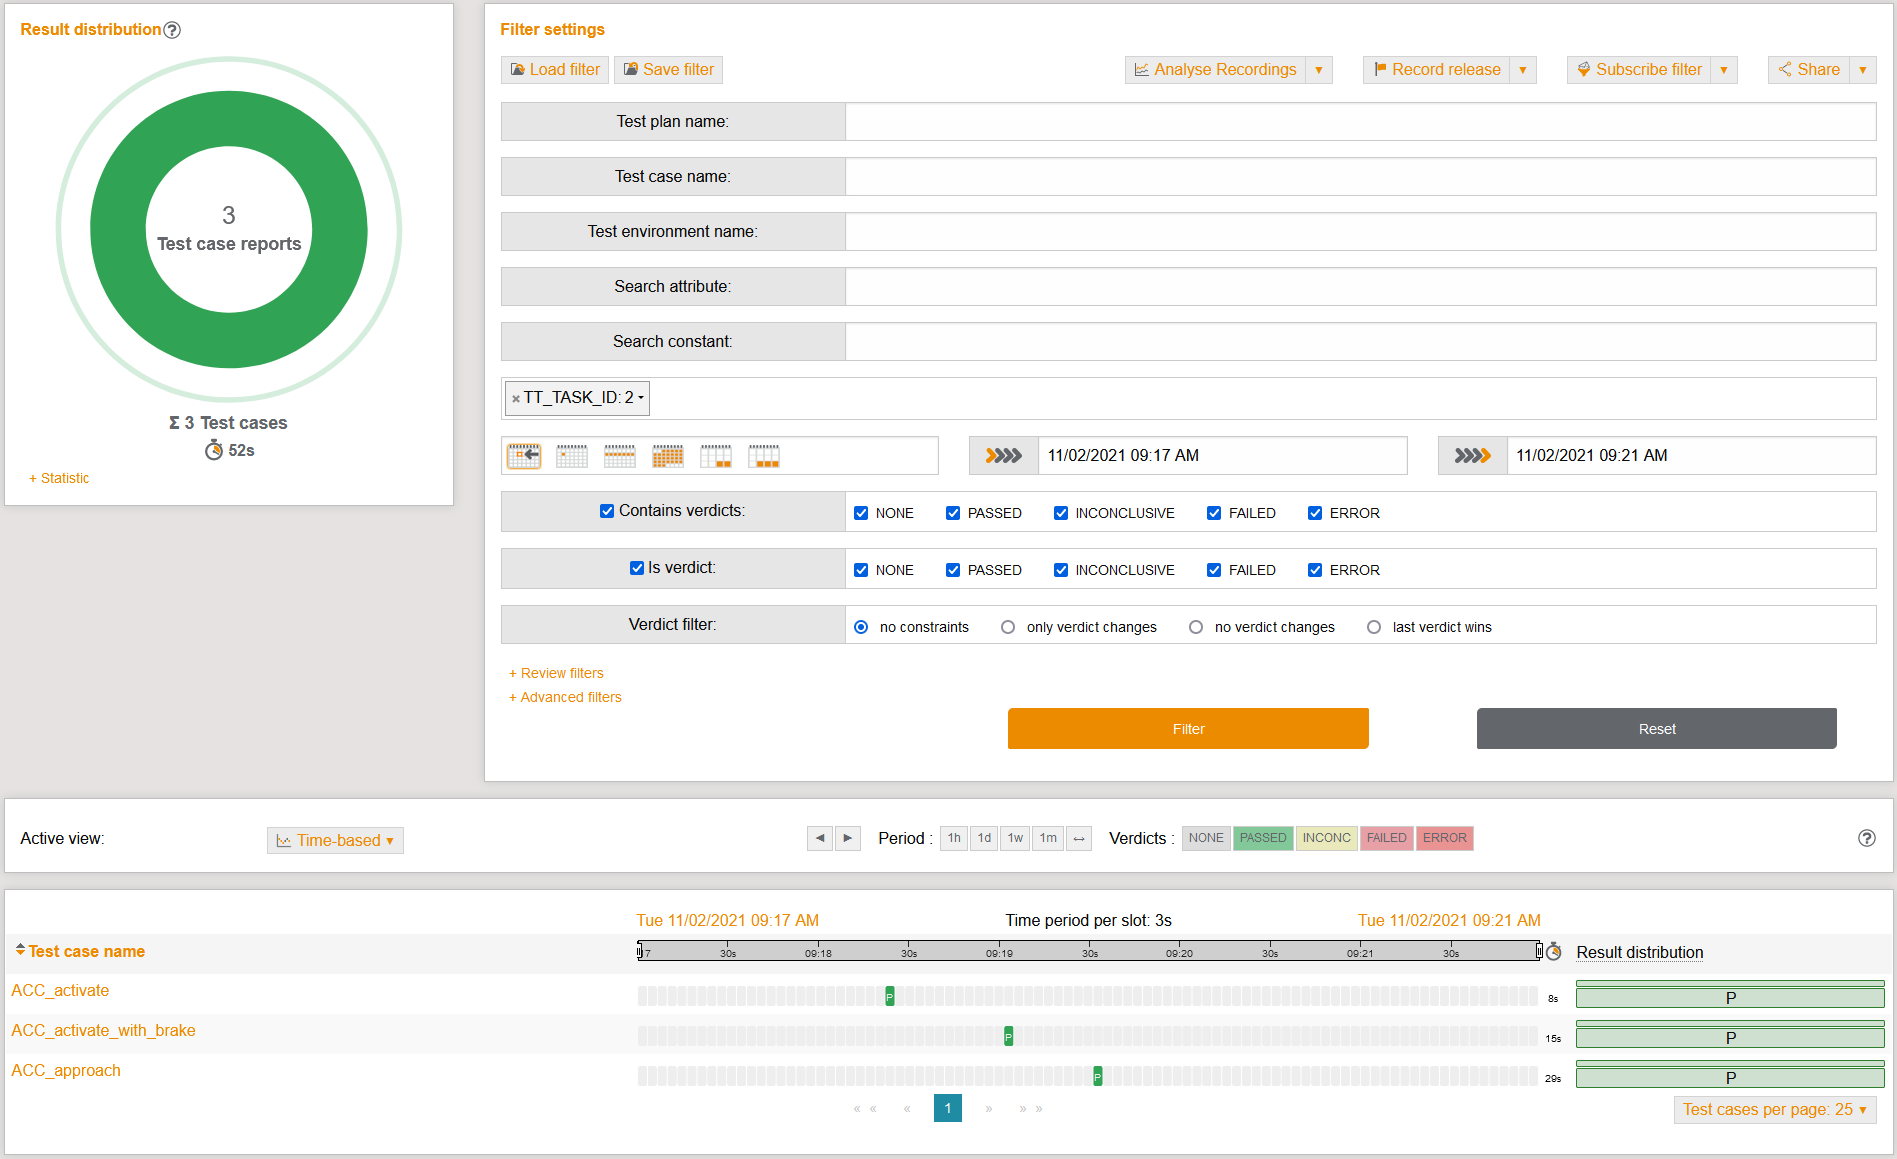
The further the automation of test executions progresses, the higher the test throughput. As a result, countless test results will have to be sifted through and evaluated.
In addition to a wide range of filter options for a detailed view of the results, test.guide has an integrated correction process - the Review. This helps to detect and display clearly any errors and inconsistencies that may occur during vehicle software testing.
Errors that occur can be recorded and forwarded to a connected ticket system (e.g., Jira, Redmine, Octane, etc.).
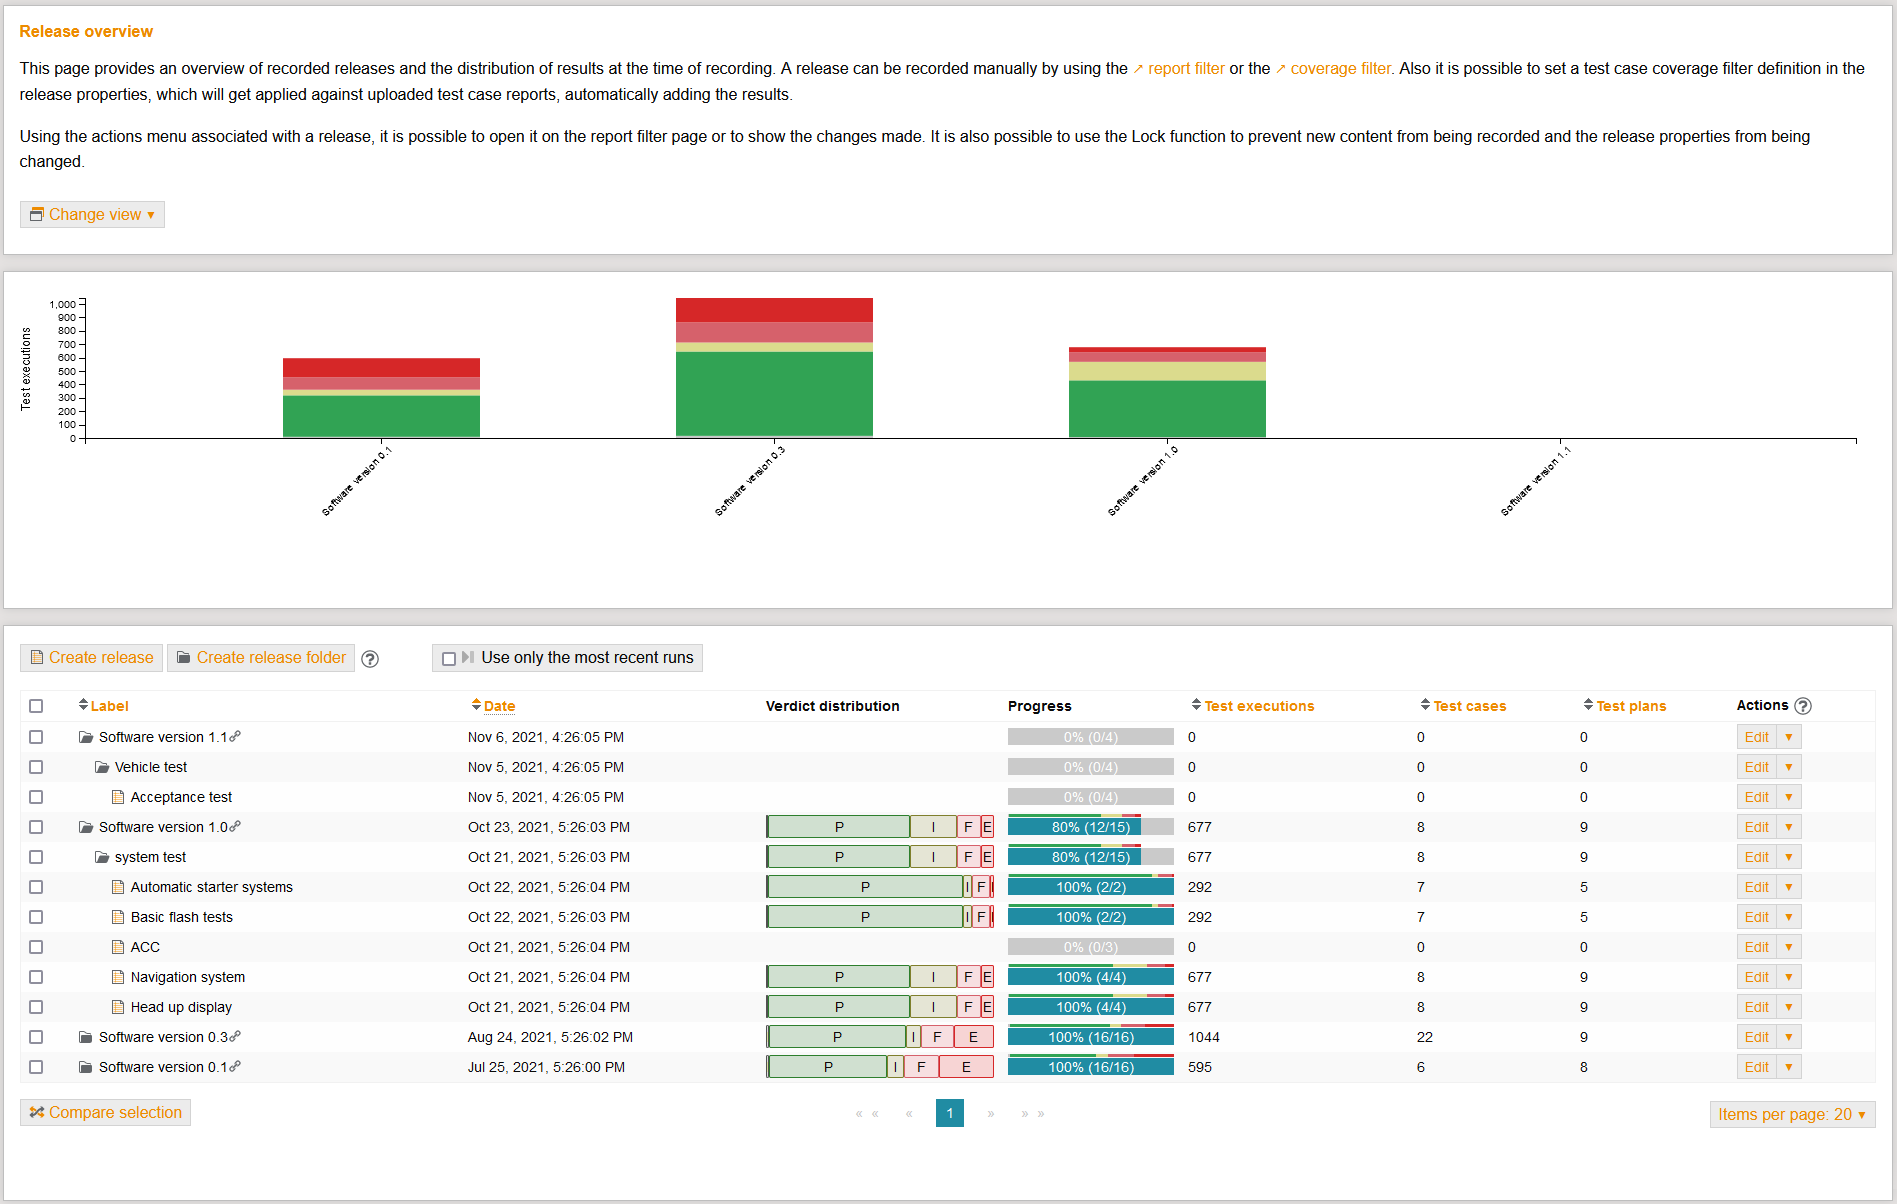
Test result release
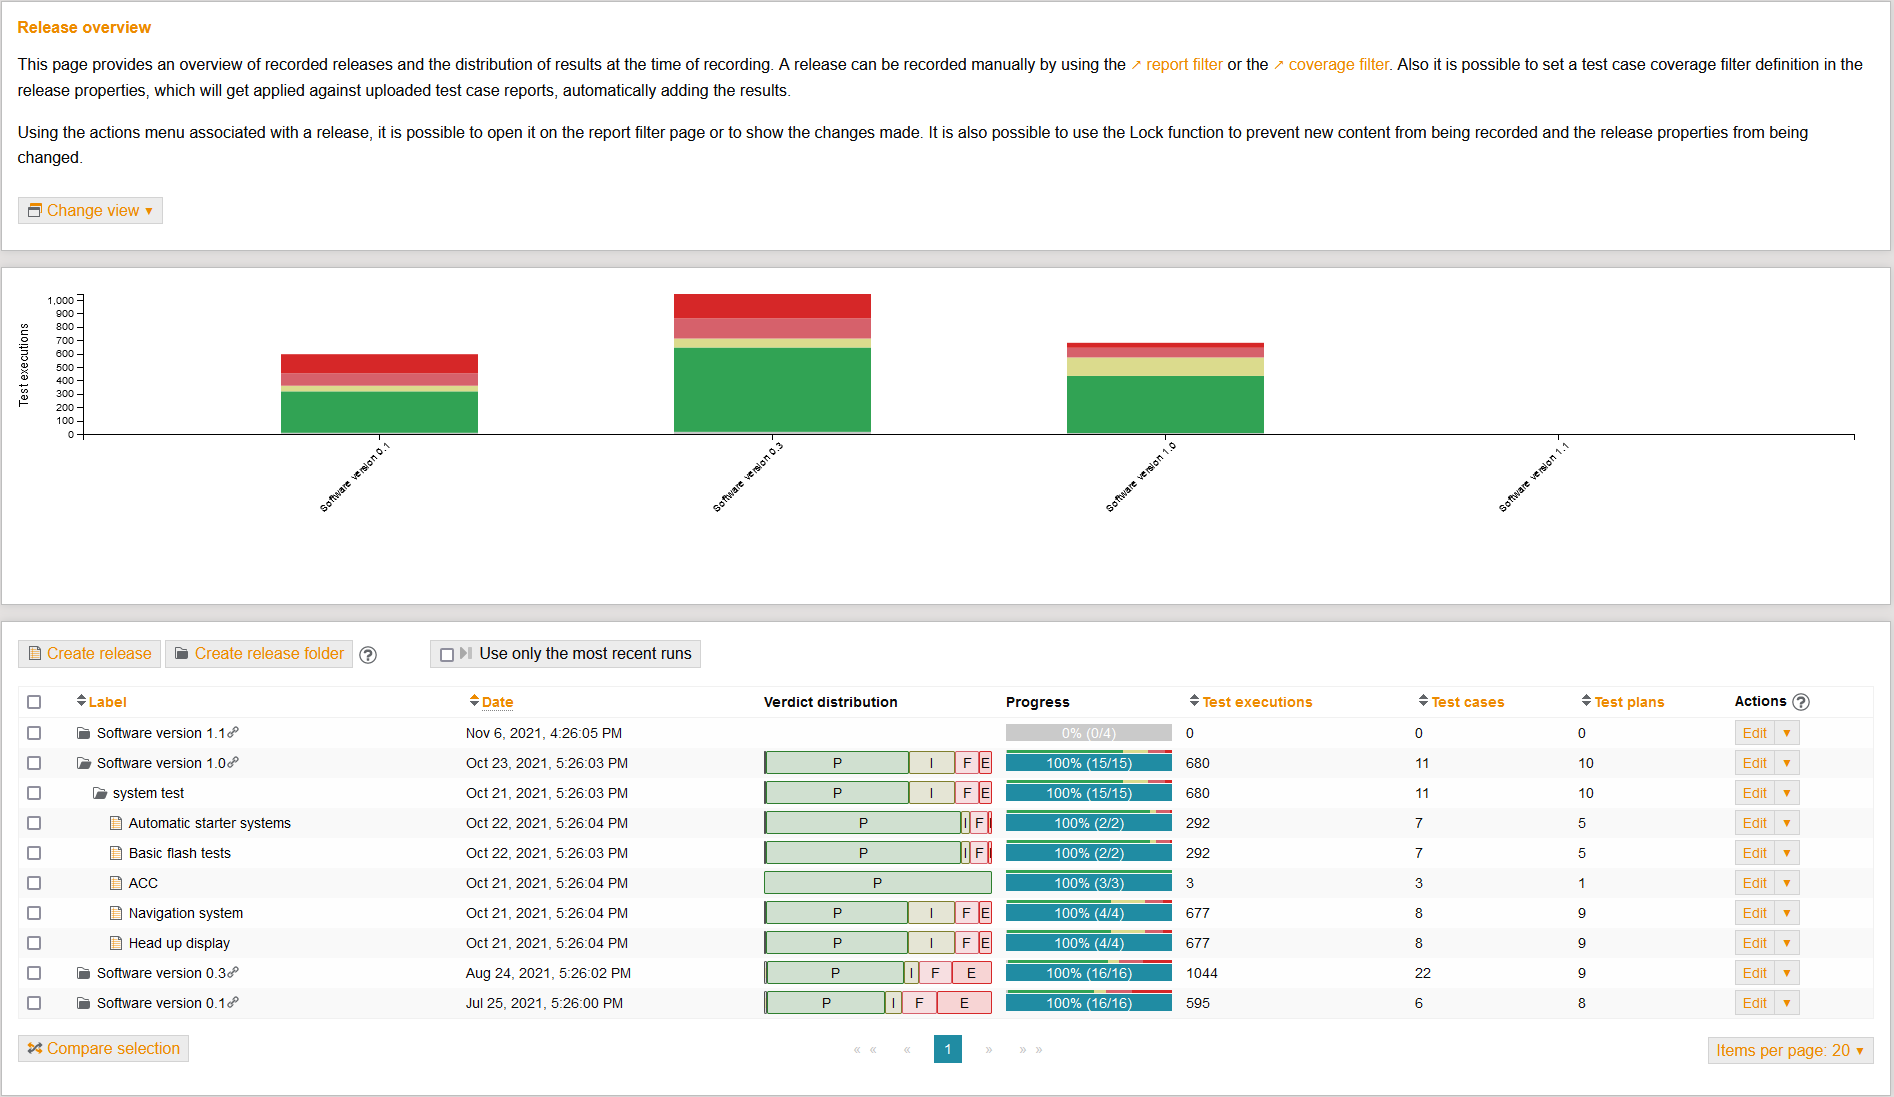
Release represents the conclusion of the test activities.
The summary of test results in release and coverage overviews is based on the test scopes defined at the beginning.
The link between planning, implementation and results forms the basis for producing informative final reports.
The summary of test results in release and coverage overviews is based on the test scopes defined at the beginning.
The link between planning, implementation and results forms the basis for producing informative final reports.
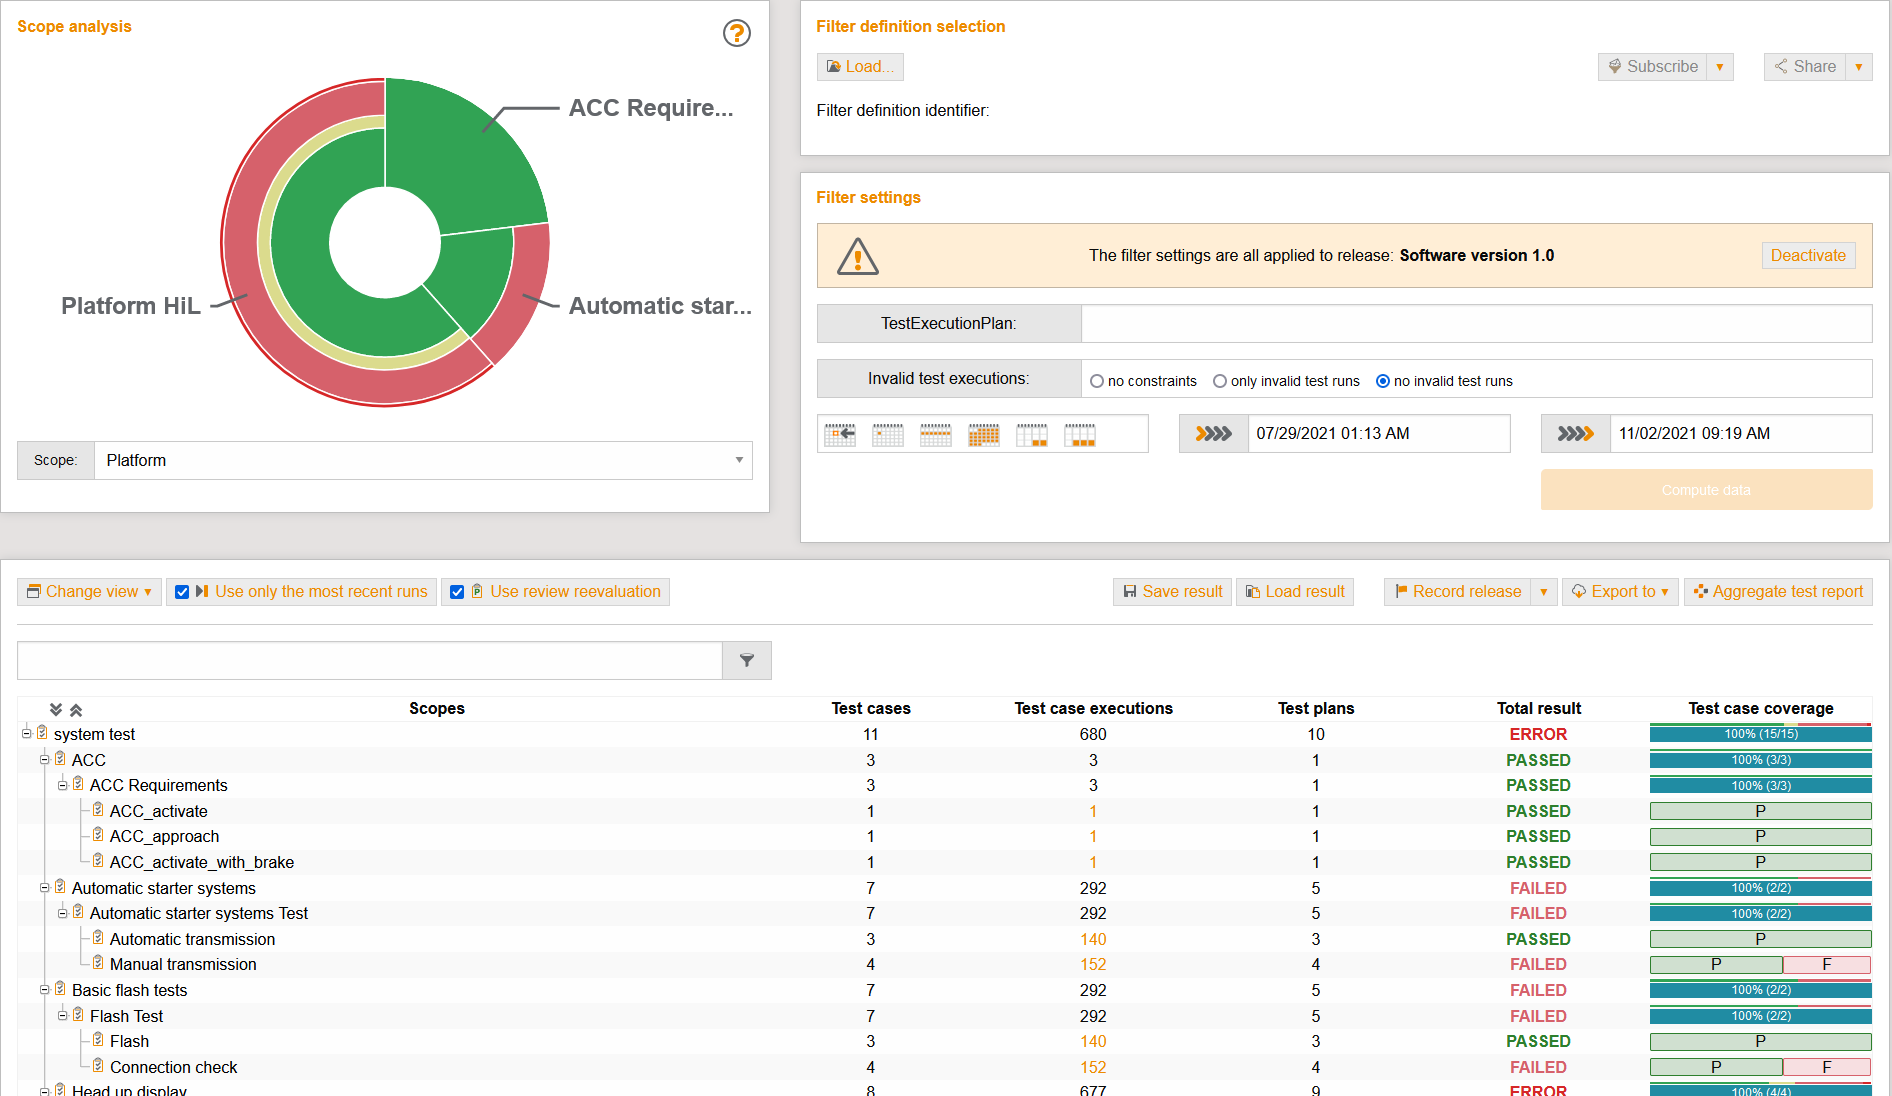
Test infrastructure and test results monitoring
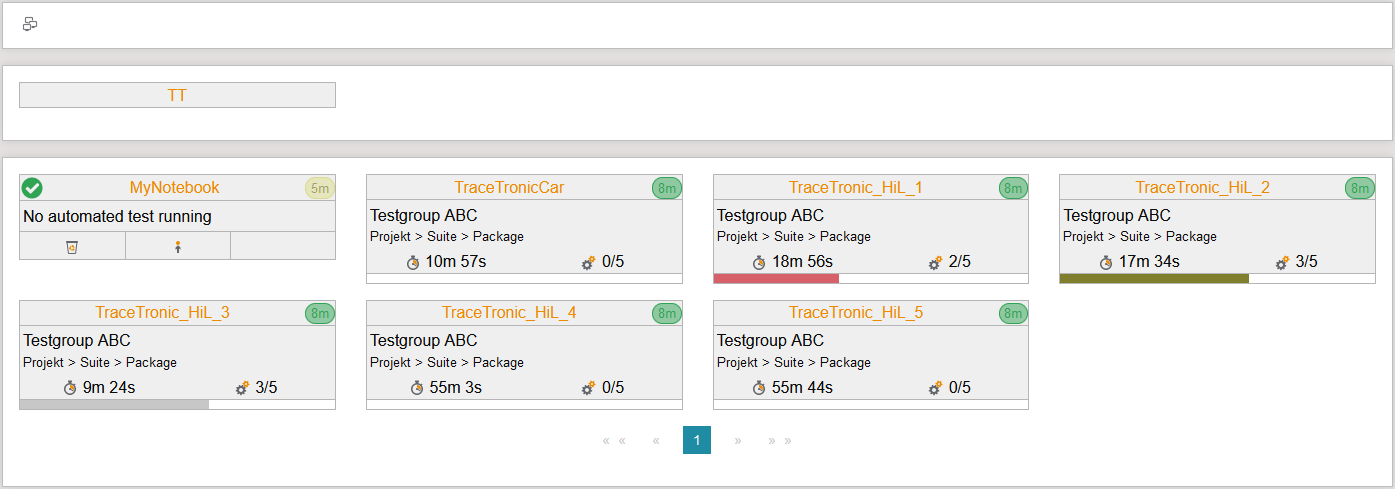
Monitoring is a continuous phase that accompanies development and provides an overview of all activities from planning to the summary of test results.
Which test benches are connected? What condition is the test bench in? Which test case is currently being executed? How high is the test case coverage? And which test executions are "failed"? Within the Automotive DevOps Platform, this comprehensive monitoring is handled by test.guide.
Which test benches are connected? What condition is the test bench in? Which test case is currently being executed? How high is the test case coverage? And which test executions are "failed"? Within the Automotive DevOps Platform, this comprehensive monitoring is handled by test.guide.
Platform features
Execution distribution
Imagine executing thousands of test cases throughout the release process as efficiently as possible, i.e., in the most time-focused and resource-optimized manner possible. Test executions would then run in the correct sequence and simultaneously in the correct test environment, automated and round the clock.
There would be quick and continuous feedback, no idle time of test resources and a hub in terms of development speed. Doesn't seem realistic?
Well, it is! We have developed and successfully tested the perfect solution – execution distribution with ecu.test and test.guide.
In practice, the search for the perfect match of test order and test bench is still mostly carried out manually, but this is not a very efficient method. With execution distribution, it is possible to automate this allocation. The setup requires only a few steps:
- 1. Install ecu.test
- 2. Install test.guide
- 3. Install and configure ResourceAdapter
- 4. Configure data storage in test.guide
- 5. Export playbook from ecu.test to test.guide
- 6. Sit back and watch
Playbooks describe what the test task is. They are created directly in ecu.test or test.guide and exported to the test.guide data storage via an integrated public interface. test.guide becomes active if there are new playbooks in it. The tool independently organizes the distribution of test orders on the suitably configured test benches in the order of their prioritization. The tool is supported by ResourceAdapter, a software installed on the test benches.
However, execution distribution also solves another problem that often occurs. After the test order is allocated, all the conditions for test execution have to still be created at the test station. Repositories need to be checked out, data copied back and forth, and additional dependencies resolved. ResourceAdapter does all this too – based on the description in the playbook.
Downstream analysis distribution
Classically, each automated test of new software artifacts is seamlessly followed by the associated analysis of the trace records created in the process (such as bus logs for instance) and test evaluation. But this way is very time-consuming and not very practical for tests with countless variants and scenarios. Extensively configured hardware-in-the-loop (HiL) test benches are already in continuous operation specifically for testing and validating newly developed ECU software.
With the principle of downstream analysis distribution by test.guide, more performance can be achieved with the same capacity.
After ecu.test executes test orders on HiL test benches, analysis orders are created and transferred to a configured test.guide. In combination with ResourceAdapter, which continuously provides information about available computing capacities, test.guide distributes these orders to test bench independent ecu.test instances (PC, virtual machine, cloud). This is where analyses of the test results – the so-called trace analysis – are performed.
The results in the form of test reports are automatically stored in test.guide and provide the basis for detailed evaluations.
In this way, valuable test resources are not blocked by evaluations and the test throughput can be increased significantly. In addition, the parallelization of evaluation allows further scaling of the test scopes to be executed.
Cache synchronization
Everyone is aware of the problem – the larger the file, the more extensive its content and the longer it takes to open. The same thing happens when reading bus/service databases and A2L files. These are very large databases with complex formats that must be read in by ecu.test each time the configuration starts, and parsed for further use. This process sometimes takes very long.
Therefore, the idea is to store this data centrally – in a cache – after it is read in for the first time. Caching is perfect when there are many users using the same database. They can access the same cache memory simultaneously and quickly. This not only enormously improves the efficiency of data retrieval and data return, but also significantly boosts the performance of ecu.test.
The only requirement is to set up a central storage location for the cache in the workspace settings of ecu.test. After reading in the database in ecu.test, the associated cache of the bus or service databases is stored encrypted on the configured network drive.
However, since there is mostly no structured process to access a network drive, important artifacts can be accidentally deleted. It is therefore better to store the cache for exchange in any configured test.guide depository (e.g., Artifactory or S3).
Users of other ecu.test instances can access the cache from there and thus avoid the time-consuming creation of their own cache. Access tokens are configured once in test.guide for this purpose. If the input data changes, the cache is recreated and synchronized with the already stored cache. This makes starting the configuration much faster.
In our own test environment, this feature allowed us to reduce the duration of our night run from over six hours to 2.5 hours.
This is the place for me!
This is the solution to your problem? Then contact our sales team and get more information or arrange an appointment with us.
Would you like to see the latest features? Then browse through our product demos.